Decoding Green Export Trends: Data-Driven Sourcing Insights

1. The “What & Why”: Understanding the Shift Toward Green Exports
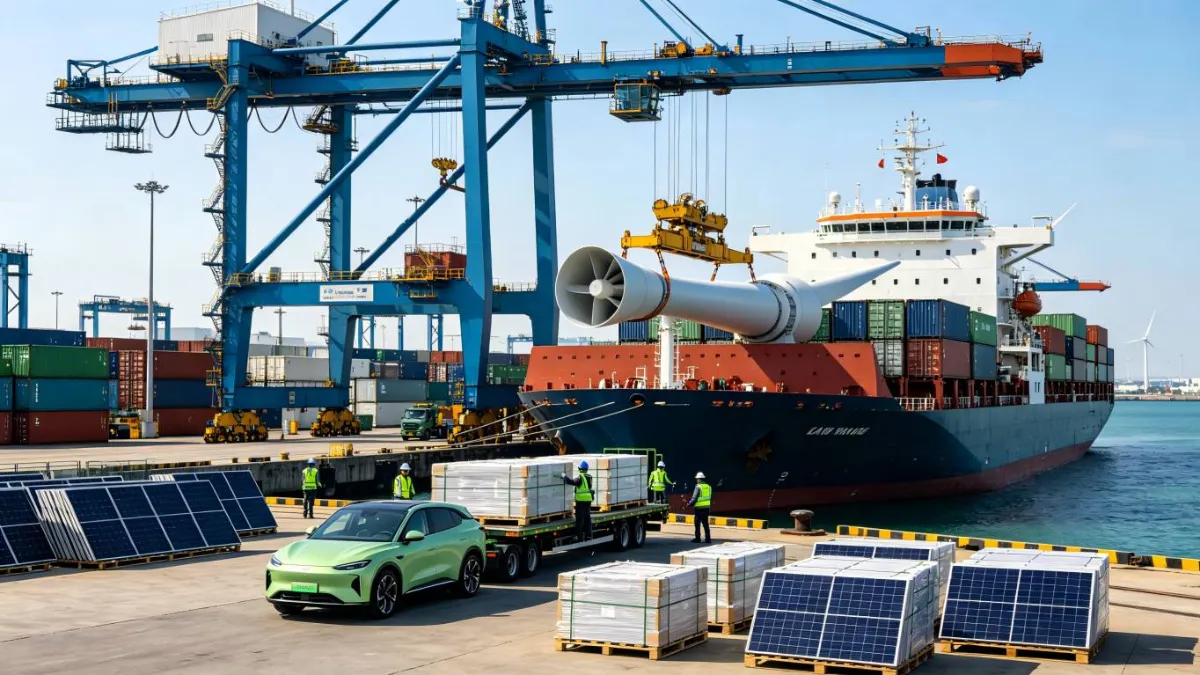
“Green exports” refer to traded goods that directly support the global energy transition—primarily electric vehicles (EVs), solar panels, wind turbines, and energy storage systems. Unlike traditional export categories, their growth is not purely market-driven; it is shaped by policy mandates, capital flows, and sustainability requirements.
Over the past two years, Google Trends has shown a consistent rise in search interest for terms such as “EV supply chain,” “solar panel suppliers,” and “battery sourcing.” This signals a shift in buyer behavior:
- Procurement teams are moving upstream, researching supply markets earlier
- Supplier selection criteria now include carbon footprint, compliance, and traceability
- Demand signals are increasingly visible before actual trade flows materialize
In practical terms:
Search behavior is becoming a leading indicator of sourcing demand, while export data remains a lagging confirmation of supply reality.
2. Decoding the Numbers: What Export Data Reveals
To understand how this trend translates into real trade flows, we turn to customs export data, which provides a grounded view of supply distribution.
2.1 Global Growth Across Green Export Categories
The expansion of green exports is not uniform—different segments are growing at different speeds:
📊 Global Green Export Growth by Category (2023–2025)
| Category | Key Products | Export Growth Rate | Main Export Regions | Buyer Demand Trend |
|---|---|---|---|---|
| Electric Vehicles | EV units, battery packs | +25% – 35% | China, EU | Rapid increase |
| Solar Energy | PV modules, inverters | +20% – 30% | China, Vietnam | Stable growth |
| Wind Energy | Turbines, blades | +10% – 18% | EU, India | Moderate growth |
| Energy Storage | Lithium-ion batteries | +30% – 40% | China, South Korea | High surge |
Interpretation: Energy storage is emerging as the fastest-growing segment, reflecting a structural shift:
The market is moving from energy generation → energy management (storage + efficiency).
2.2 Where Supply Actually Comes From
Export data also highlights a clear regional structure in global supply:
🌍 Top Exporting Countries by Green Product Segment
| Rank | Country | Strength Area | Competitive Advantage |
|---|---|---|---|
| 1 | China | Solar, batteries | Scale + integrated supply chain |
| 2 | Germany | Wind, EV engineering | High standards + advanced tech |
| 3 | South Korea | Batteries | Technology + stable quality |
| 4 | Vietnam | Solar assembly | Cost efficiency + trade advantages |
| 5 | India | Wind, components | Growing capacity + policy support |
Interpretation:
- China remains a full-stack supplier
- Europe leads in high-spec, regulation-driven exports
- Southeast Asia and India act as emerging alternatives in diversified sourcing strategies
2.3 Making Trade Data Understandable
For new buyers, trade terminology can be simplified:
⚙️ HS Code Breakdown (Simplified for Buyers)
| HS Code | Product Category | What It Means (Simple) |
|---|---|---|
| 8541 | Solar Panels | Core electricity-generating units |
| 8507 | Lithium Batteries | Energy storage backbone |
| 8703 | Electric Vehicles | Finished EV exports |
| 8504 | Power Converters | Devices that convert and regulate energy |
Interpretation: HS Codes function as a global product classification system, enabling buyers to track supplier activity and compare trade flows consistently.
2.4 The Critical Insight: Demand–Supply Mismatch
When combining Google Trends with export data, a key pattern emerges:
🔍 Google Trends vs Export Supply Mismatch
| Product Category | Google Trends Index (Demand) | Export Supply Concentration | Key Risk Signal |
|---|---|---|---|
| EV Batteries | 85–100 (Very High) | Highly concentrated (Asia) | Supply bottleneck risk |
| Solar Panels | 70–85 (High) | Dominated by China | Pricing dependency |
| Wind Components | 50–70 (Moderate) | Regionally diversified | Logistics complexity |
| EV Charging Systems | 80–95 (High) | Emerging suppliers | Supplier qualification risk |
Interpretation: The highest-risk scenarios occur when:
- Demand (search interest) is high and rising
- Supply is geographically concentrated
This creates:
- Price volatility
- Longer lead times
- Supplier negotiation pressure
3. Sourcing Strategy: Practical Guidance for Buyers
For procurement teams transitioning into data-driven sourcing, the goal is not more data—but better decision frameworks.
📉 Sourcing Risk Indicator Framework
| Signal Type | What to Watch | Risk Level | Suggested Action |
|---|---|---|---|
| High demand + low supply | Google Trends ↑ / Export ↓ | 🔴 High | Lock suppliers early |
| High concentration | One country dominates | 🔴 High | Diversify sourcing |
| Rapid growth category | Export growth >30% | 🟠 Medium | Monitor price volatility |
| Emerging suppliers | New export countries appear | 🟡 Low | Test small-volume sourcing |
3.1 Three Beginner-Friendly Sourcing Actions
1. Monitor Demand Before It Becomes Price Pressure
- Track keyword trends (e.g., EV batteries, solar inverters)
- Identify demand spikes early
- Engage suppliers before peak sourcing cycles
2. Diversify Beyond Geography
-
Separate sourcing across:
- Components
- Assembly
-
Reduce dependency on a single supply chain layer
3. Leverage Data Tools for Supplier Discovery
-
Use structured trade data to:
- Identify active exporters
- Validate supplier experience
-
Shift from:
- “Searching for suppliers” → to
- “Analyzing who is already supplying at scale”
In this context, platforms like SourcingX focus on structuring fragmented trade and supplier data, helping buyers:
- Shortlist suppliers based on actual export activity
- Reduce early-stage screening complexity
- Improve sourcing efficiency without relying solely on manual processes
4. What This Means for the Future of Procurement
Green export trends are not cyclical—they represent a long-term restructuring of global trade flows.
Three implications stand out:
1. Procurement Becomes Data-Led
-
Decisions increasingly rely on:
- Demand signals
- Trade flow analysis
- Supplier performance data
2. Compliance Becomes a Core Filter
-
Carbon and ESG requirements will directly influence:
- Supplier eligibility
- Market access
3. Speed Becomes a Competitive Variable
-
The time between:
- Demand signal → sourcing decision is shrinking
Companies that act earlier on data signals will:
- Secure better pricing
- Access more reliable suppliers
- Build more resilient supply chains
Final Takeaway
The rise of green exports—across EVs, solar, and wind—is redefining how global sourcing operates.
- Google Trends reveals where demand is forming
- Export data shows where supply is concentrated
- The gap between them defines sourcing risk and opportunity
For procurement teams, the shift is clear:
From reactive sourcing to data-driven, forward-looking decision-making
Those who can interpret and act on these signals early will not only reduce risk—but gain a structural advantage in an increasingly complex global supply landscape.
Comments
0